There are many ways to organize data. Today we learn one way: the "tidy data" format. It is rather simple, but deceptively powerful.
Mon Sep 19, 2016
What is Tidy Data?
What is Tidy Data?
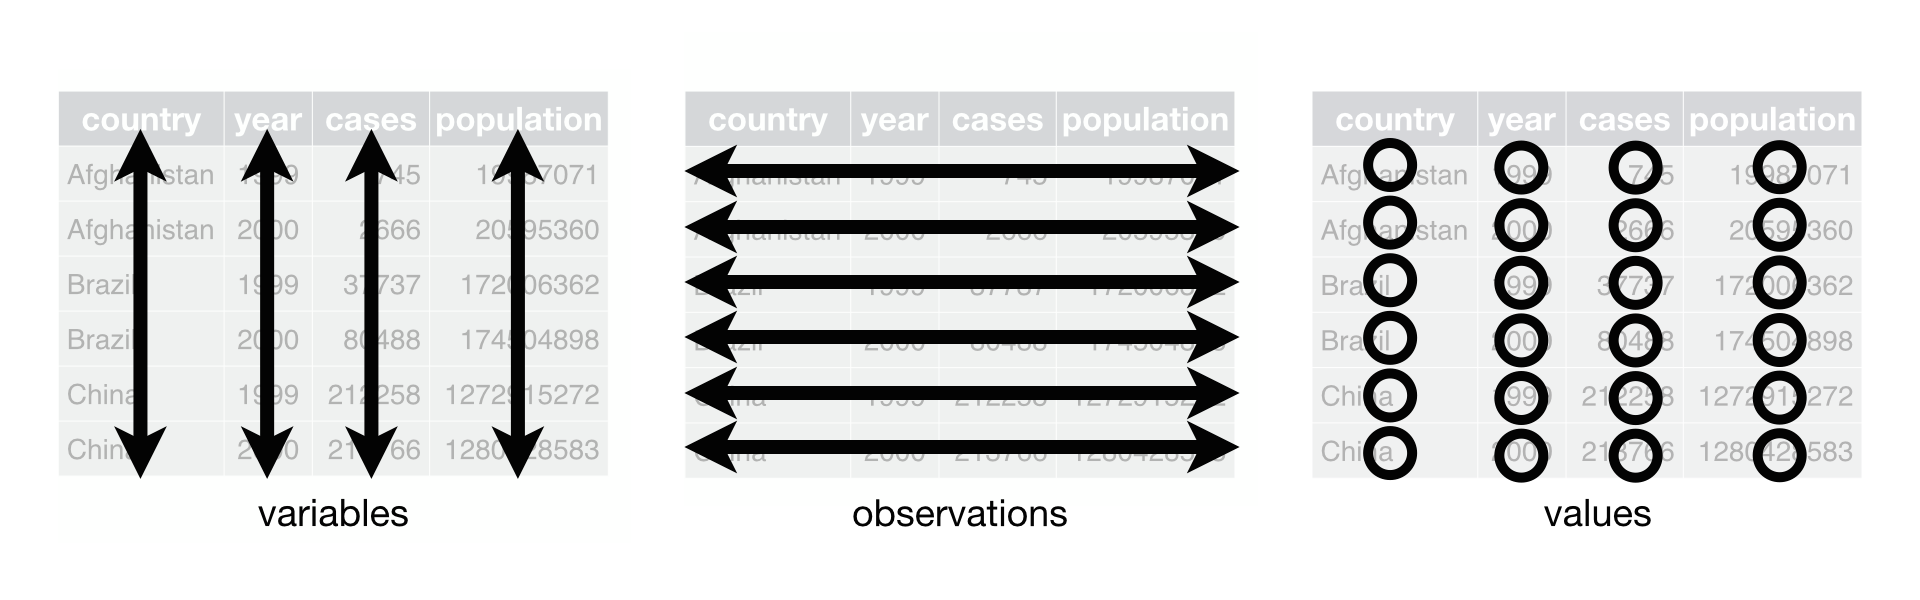
- Each variable forms a column.
- Each observation forms a row.
- Each type of observational unit forms a table.
The third point means we don't mix apples and oranges, keep apples together with apples.
What is Tidy Data?
This slide added on Tue 10/4:
- Each observation forms a row. In other words, each row corresponds to a single observational unit
- Each variable forms a column:
- Some of the variables may be used to identify the observational units. For organizational purposes, it's generally better to put these in the left-hand columns
- Some of the variables may be observed values associated with each observational unit
- Each type of observational unit forms a table.
What is Tidy Data?
This is just a spreadsheet!
But we are very strict about the previous three rules.
nycflights13 Package
The nycflights13 package contains information about all flights that departed from NYC (e.g. EWR, JFK and LGA) in 2013: 336,776 flights in total. To help understand what causes delays, it also includes a number of other useful datasets:
weather: hourly meterological data for each airportplanes: construction information about each planeairports: airport names and locationsairlines: translation between two letter carrier codes and names