Announcements
- I will post a Learning Check discussion under “After-Class Updates” before the next lecture.
For example, the discussion for the Learning Checks from Lec04 are posted on that page.
- Lec04 learning check discussion.
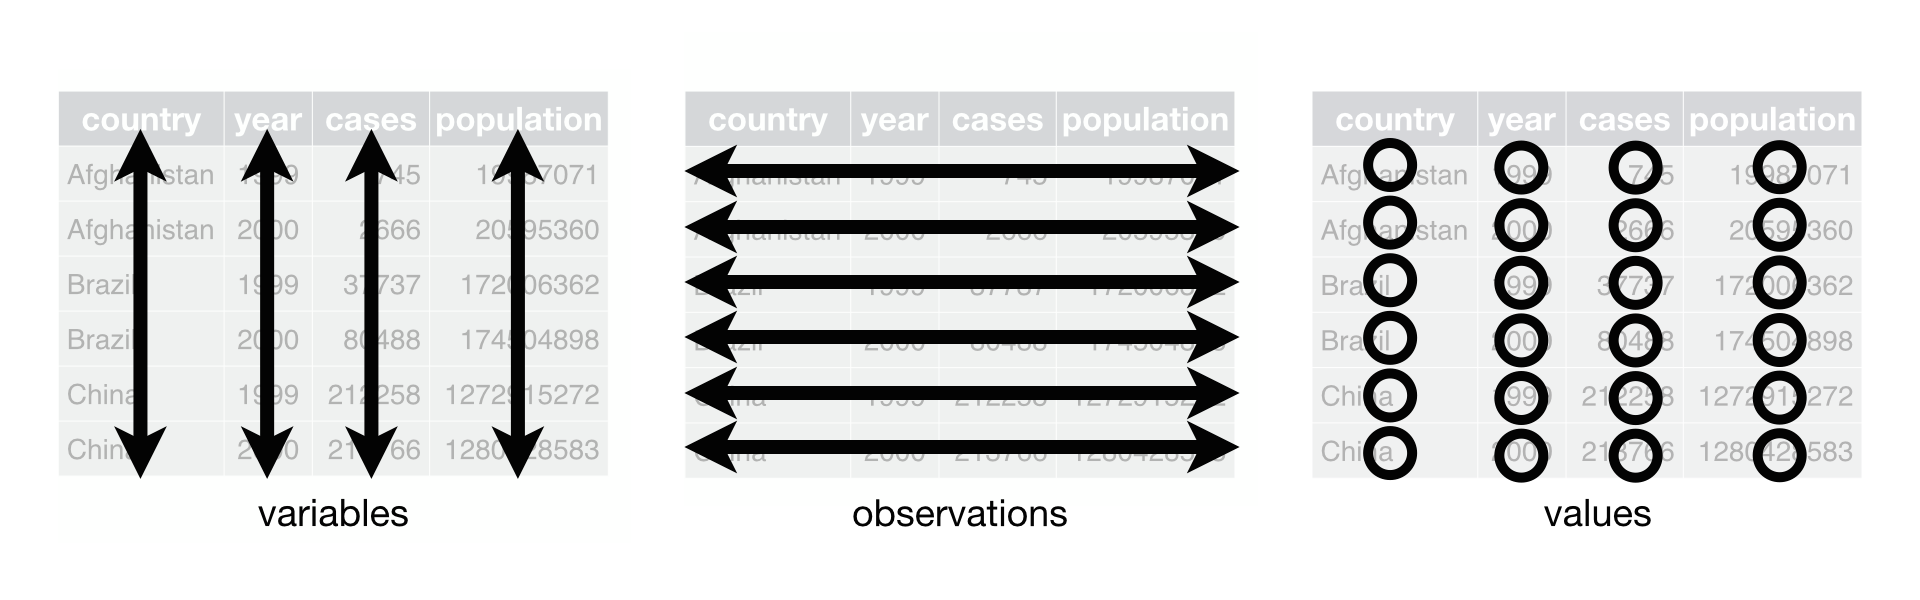
- Refresher: What is tidy data?
- Each observation forms a row. i.e. each row corresponds to a single observational unit
- Each variable forms a column:
- Some of the variables may be used to identify the observational units. For organizational purposes, it’s generally better to put these in the left-hand columns.
- Some of the variables may be values associated with each observational unit.
- Each type of observational unit forms a table.
In-Class
- Slides on the “Grammar of Graphics” and the 5NG: the five named graphs.
- Learning Check 1: For each of the 5NG examples in the above slides, following the example of Napoleon’s march and the Grammar of Graphics
- identify the
data variables being displayed and what type of variable they are
- identify the
aes()thetic attribute of the geom_etric object the above data variables are being mapped to
- Learning Check 2: Answer the following questions:
- Scatterplot: Does spending more on a movie yield higher IMDB ratings?
- Linegraph: Why are there drops in the number of flights?
- Boxplot: Click here for an explanation of boxplots. About what proportion of manual car models sold between 1984 and 2015 got 20 mpg or worse mileage?
- Barplot: About how many babies were named “Hayden” between 1990-2014?
- Histogram: What are the smallest and largest visible heights and what do you think of them? Also, think of one graph improvement to better convey information about SF OkCupid users.
After-Class Updates