HW-4
A partially open-ended real-life maps question.
Announcements
- Please sign up on Doodle from Monday’s lecture for Feedback session. For your session, please try to have your data loaded into RStudio.
- Math Talk: Tuesday Nov 8th 12:30pm Warner Hemicycle (free pizza at 12:15) “The Statistical Modeling Of Interspecies Competition On The Growth Of Trees”
- Homework 4 is now posted in the Calendar section:
- This is the last substantive HW. HW-5 will be lighter to allow you to work on your final projects.
- Library discussion is after Thanksgiving break.
- The homework:
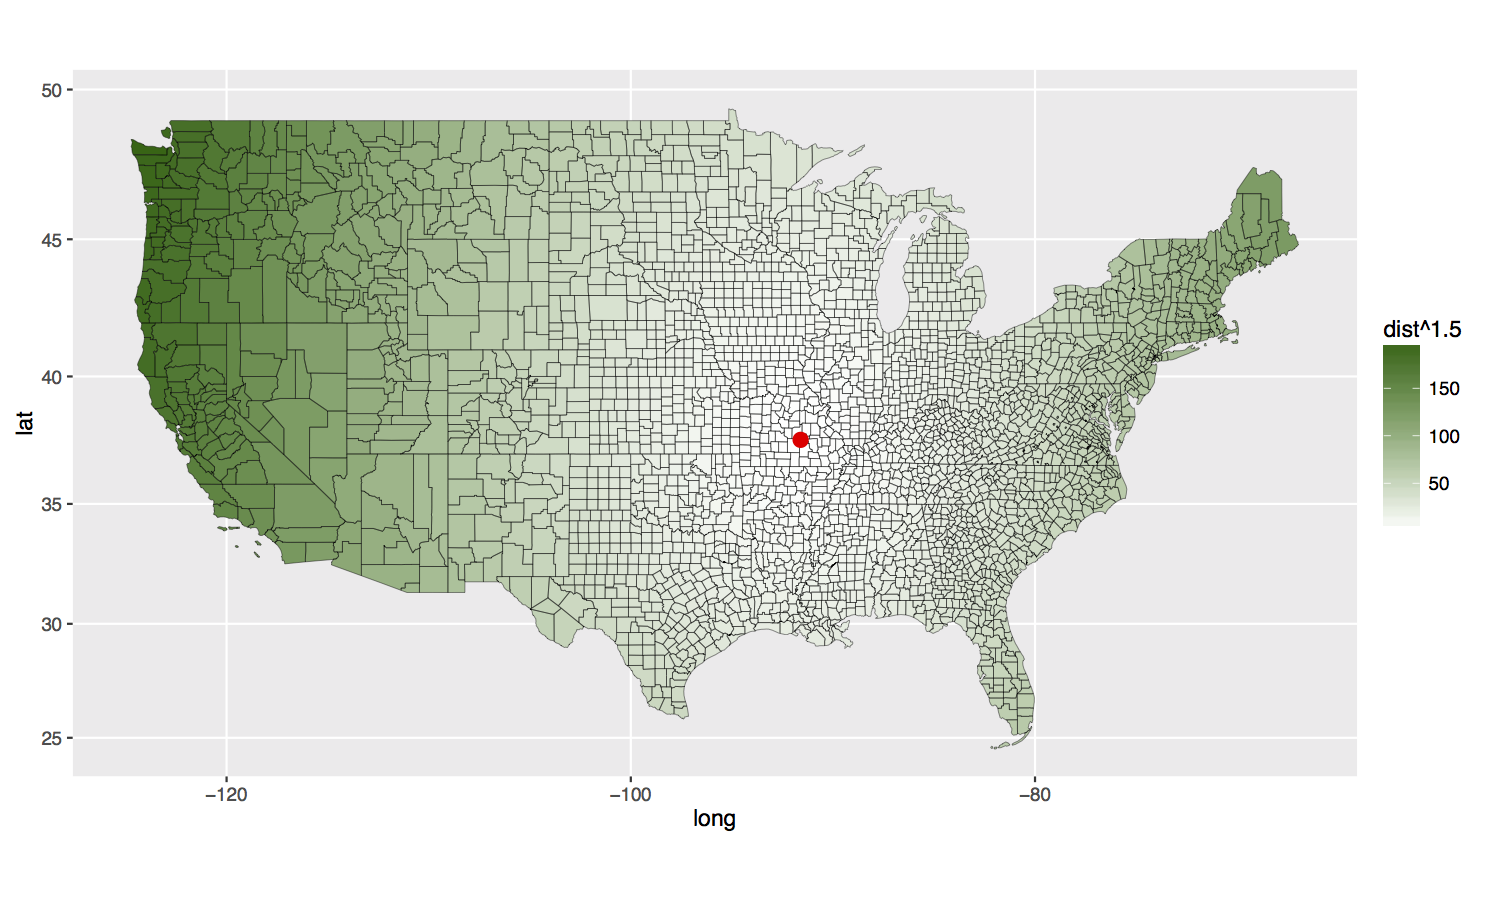
- Question: DHL, a German shipping company, has a ton of money to build a shipping hub in the United States. Where should they build it?
- Deliverable: A choropleth map of the lower 48 states (no Alaska, Hawaii, Puerto Rico) where the color corresponds to the distance of the given area to the shipping hub, which is marked on the map with a large red dot.
Strategy and Advice
This is probably the most complex (not necessarily hardest) homework I’ve ever assigned. Some strategies:
- Do not attempt to code your work right away. Rather, first focus on separating the
- What you are going to do: the blueprint/plan
- How you are going to do it: the R coding
- Confusing the “what” and the “how” will only get you lost in the weeds.
- For example, the “what” step could be tackled as follows:
- Draw on paper/blackboard/whiteboard what your starting data sources, ending data frames, and any visualizations should look like.
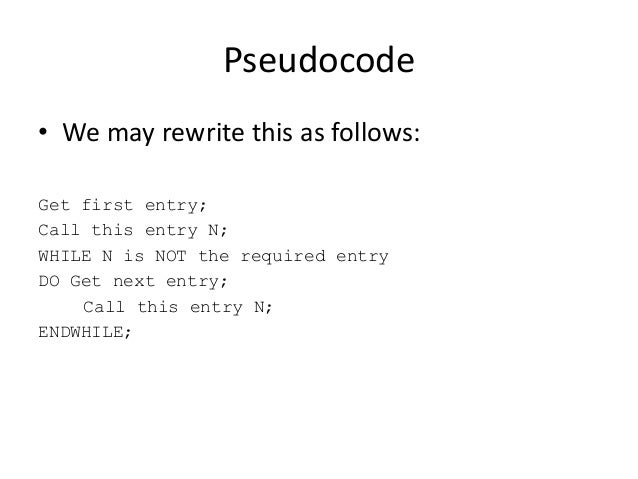
- Write out in pseudocode what your R code will look like. Pseudocode is informal and rough code that doesn’t necessarily need to work, but still illustrates completely what you want to do. More than anything else, writing pseudocode out forces you to think your plan out loud.
- See my MATH 116 Intro to Statistical and Data Sciences Problem Set 06 Discussion Tips section for an example.
Also…
- I highly encourage you to work in groups on this problem set, especially for the brainstorming of the “what”.
- Give it 8-12 hours total, if you don’t get it: don’t freak. Google interview strategy of deliberately trying to “break” people and seeing how they react.
- The Effective Analyst. Highlights:
- Slide 3: What analysts do.
- Slide 4: Emphasizing the full data/science pipeline
- Slide 6: The importance of
View()ing your data ASAP - Slide 10: Don’t thrash! It’s ok to ask for help!
- Slide 13: Take things end-to-end ASAP, then iterate to improvement.
- Slide 15: Perfectionism leads to paralysis. Sheryl Sandberg’s quote “Done is better than perfect.”
- Slide 20: The (very ambiguous) criteria for promotion, which will also be the “rubric” for your final projects.
Discussion
1. Notes
- Fun facts: Shifting demographics and what UPS and FedEx do
- Tidy data principle: As much as possible keep apples with apples and oranges with oranges. i.e.
- Put data relating to 3000 counties in same data frame:
- County population i.e. weights
- County centroid lat/long coordinates
- Put data relating to large # of polygon points in same data frame
- Polygon points
- Distance (for
fillaesthetic forgeom_polygon)
- Put data relating to 3000 counties in same data frame:
- Distances: Using lat/long is not quite a valid distance due to curvature of earth
- Sharing your work/reproducibility: If you’re trying to promote your
work and it doesn’t work, people will tune out! For example
- Share all files needed to recreate analysis.
- File paths!
2. File Paths
The following absolute file path will not work on most people’s computers:
read_csv("~/Desktop/Senior Year/Data Science/Homeworks/HW-4/R11276882_SL050.csv")`
whereas the following relative file path will work. It assumes the working
directory is the same directory that contains your .Rmd file.
read_csv("R11276882_SL050.csv")
You can navigate up and down the directory tree:
read_csv("sub_directory/test.csv")goes down into a subdirectory and looks for the CSVread_csv("../another_directory/test.csv")goes up one directory, then down into another, and then looks for the CSV
3. My Approach
Output: