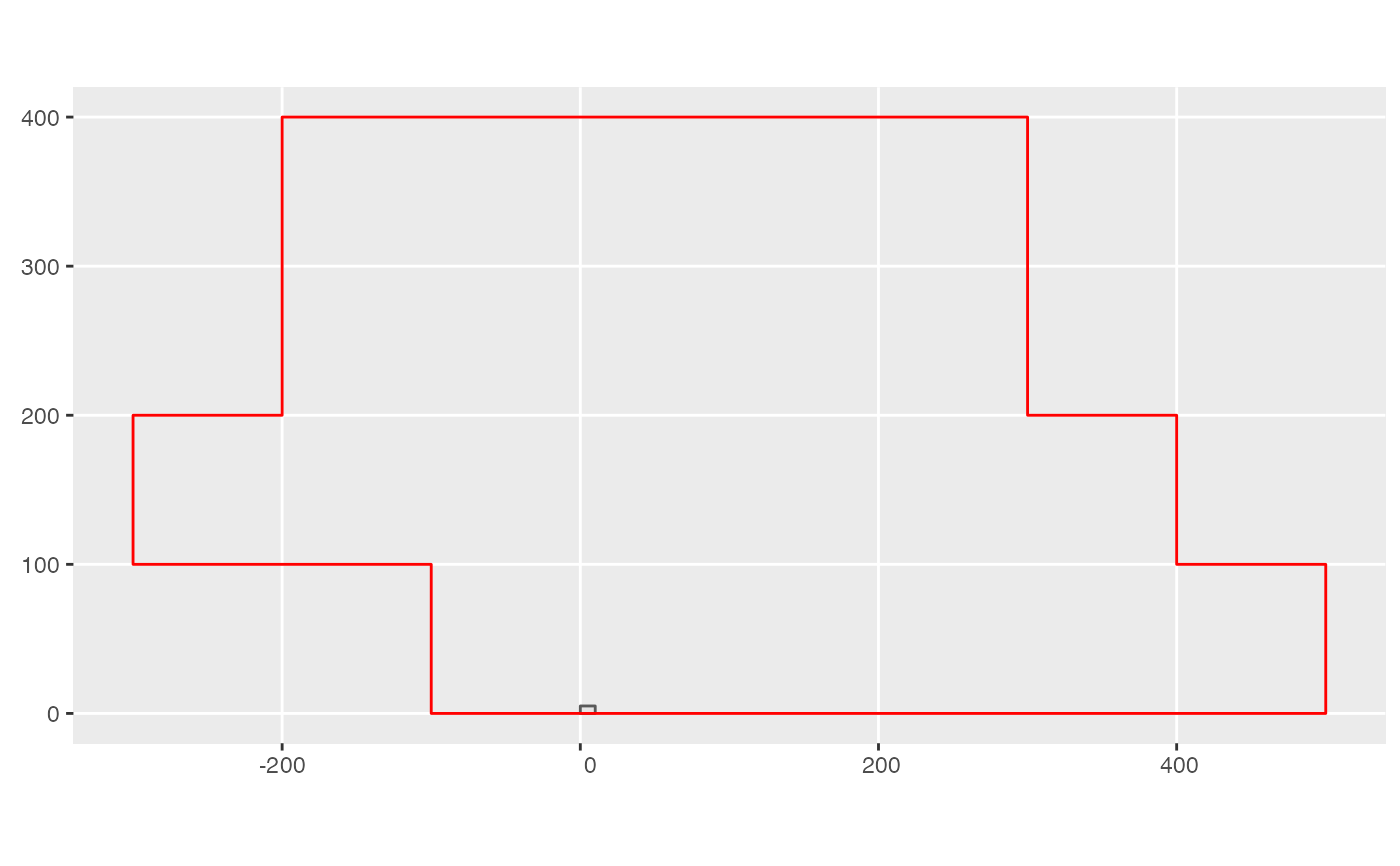
Boundary region for small example data set defined in terms of (x,y) vertices of a polygon.
study_region_ex
Format
A sf spatial features polygon
See also
Other example data objects:
blocks_ex,
census_1_ex,
census_2008_bw,
census_2014_bw,
census_2_ex,
comp_bayes_lm_ex,
focal_vs_comp_ex,
growth_ex,
growth_spatial_ex,
growth_toy,
species_bw,
study_region_bw
Examples
library(ggplot2)
library(sf)

# Convert stems to sf object
census_1_ex_sf <- census_1_ex %>%
  st_as_sf(coords = c("gx", "gy"))

# Plot stems with plot boundary
ggplot() +
  geom_sf(data = study_region_ex) +
  geom_sf(data = study_region_bw, color = "red", fill = "transparent")